About 5,000 pages of Excel templates, calculators, connectors, finance data and chart guides came out of one JSON content model. I designed several of the page templates in Figma and built the engine that rendered them, around a library of blocks I started in May 2024.
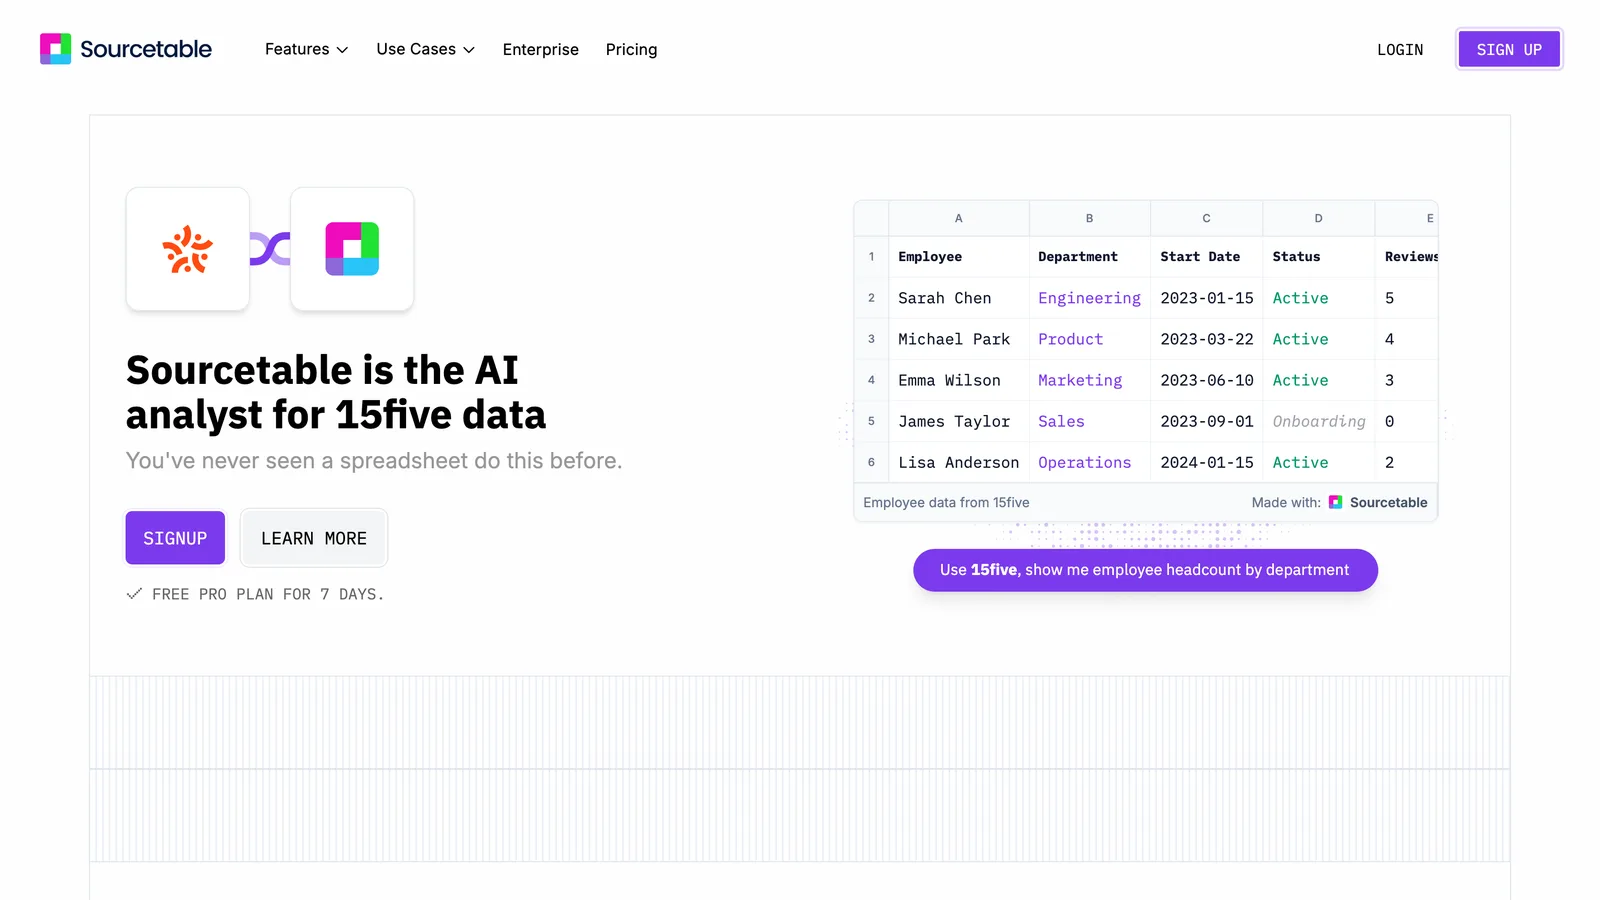
That’s the connector page for 15five, with its logo beside Sourcetable’s and a demo table labeled “Employee data from 15five”. Every connector page came from its own JSON file, rendered through the same blocks.
On Sourcetable’s site, each of those pages had to be fast and well structured without being a carbon copy of the others. Thousands of the site’s JSON files came out of another contributor’s generation pipeline. The blocks had to stay backward compatible with them while the templates went through three generations.
Build pages from parts
Each block was a Handlebars partial that rendered one section of a page from JSON, and a format name picked the layout. The library grew to about 130 blocks, and pages mixed and matched them.
Among the SEO templates I drew in Figma were a formula directory headed “Over 500 working formulas with detailed explanations” and a formula page with its syntax, examples, FAQ and related functions. I also drew shortcut pages for Excel and Google Sheets, with PC and Mac columns, and integration pages like “Integrate Mailchimp with Google Sheets”.
Every part on one page
I built KitchenSink, a localhost-only page that rendered every component at once, from 15+ hero variants, pricing tables, connector grids and blog pieces to an interactive spreadsheet with a live AI Copilot animation. Its debug mode labeled each component and printed its JSON schema, so starting a new page was mostly picking parts off a shelf. The page ran about 53,000 pixels tall. I’ve seen shorter novels.
Nothing checked an entry against those printed schemas at build time, so a bad one could reach production. Typed schemas would fail a bad entry at build.
Draw three charts live, snapshot the rest
The charting page was the paid-ad destination, gorgeous on a laptop and miserable on a phone. Its hero cycled live D3 charts in every card. I made it fast by drawing only three of them live, on a laptop only and from their first frame. Every other card, and every card on a phone, became a WebP snapshot. The CTA that leaned toward your cursor and the drag-and-drop “how it works” animations stayed on a laptop, with GSAP choreography behind them. Each hero chart kept its own screen-reader description.
The hero cards were rendered on the server, so the first paint already had them. Critical CSS was inlined while the other stylesheets loaded asynchronously, and each viewport got a WebP of its own. Some scripts waited until you scrolled to their section, and on phones the carousel was pure CSS, so less JavaScript ran while the page loaded. Reserved heights kept the layout from shifting as the charts drew. The pull request recorded these results, measured with a phone profile on simulated slow 4G and a 4× CPU throttle.
| Metric | Before | After |
|---|---|---|
| LCP | ~4.0 s | 2.84 s |
| TBT | 2,640 ms | 565 ms |
| CLS | 0.12 | ~0 |
| Transfer | 1,610 KB | 915 KB |
| Hero images | 232 KB | 87 KB |
Those are lab numbers from one page. By GA4’s count, organic search became the company’s #1 acquisition channel, with 1.6M+ sessions since 2023 and about 940K in the peak year. It brought in 24,290 signups a year, 42% of all signups, and they landed in the signup-to-paywall flow.
For years one small system carried that load, checked only by manual QA across devices, and its templates never got visual-regression tests.